I have been working hard on improvements on GPL when it comes to games. I have a direct source for live games that should update much faster on GPL and in Chat. So we'll have to see how that goes. But I have made some huge additions to the game stats summaries. Please note that this is VERY EXPERIMENTAL right now! It is only available for the MENS games as well since the womens games are not charting like that.
I built a program on my computer that ingests the official game PDF stats and converts it all to data. So it reads the crude shot charts and creates a digital version for each game. I will say right off the bat that the charts will never be 100% accurate. The PDF output has so much overlapping and it does it's best to read the code to give me a better output. But it does look pretty impressive.
Click for a larger version. The left side is our new digital chart, the right is the actual PDF output.
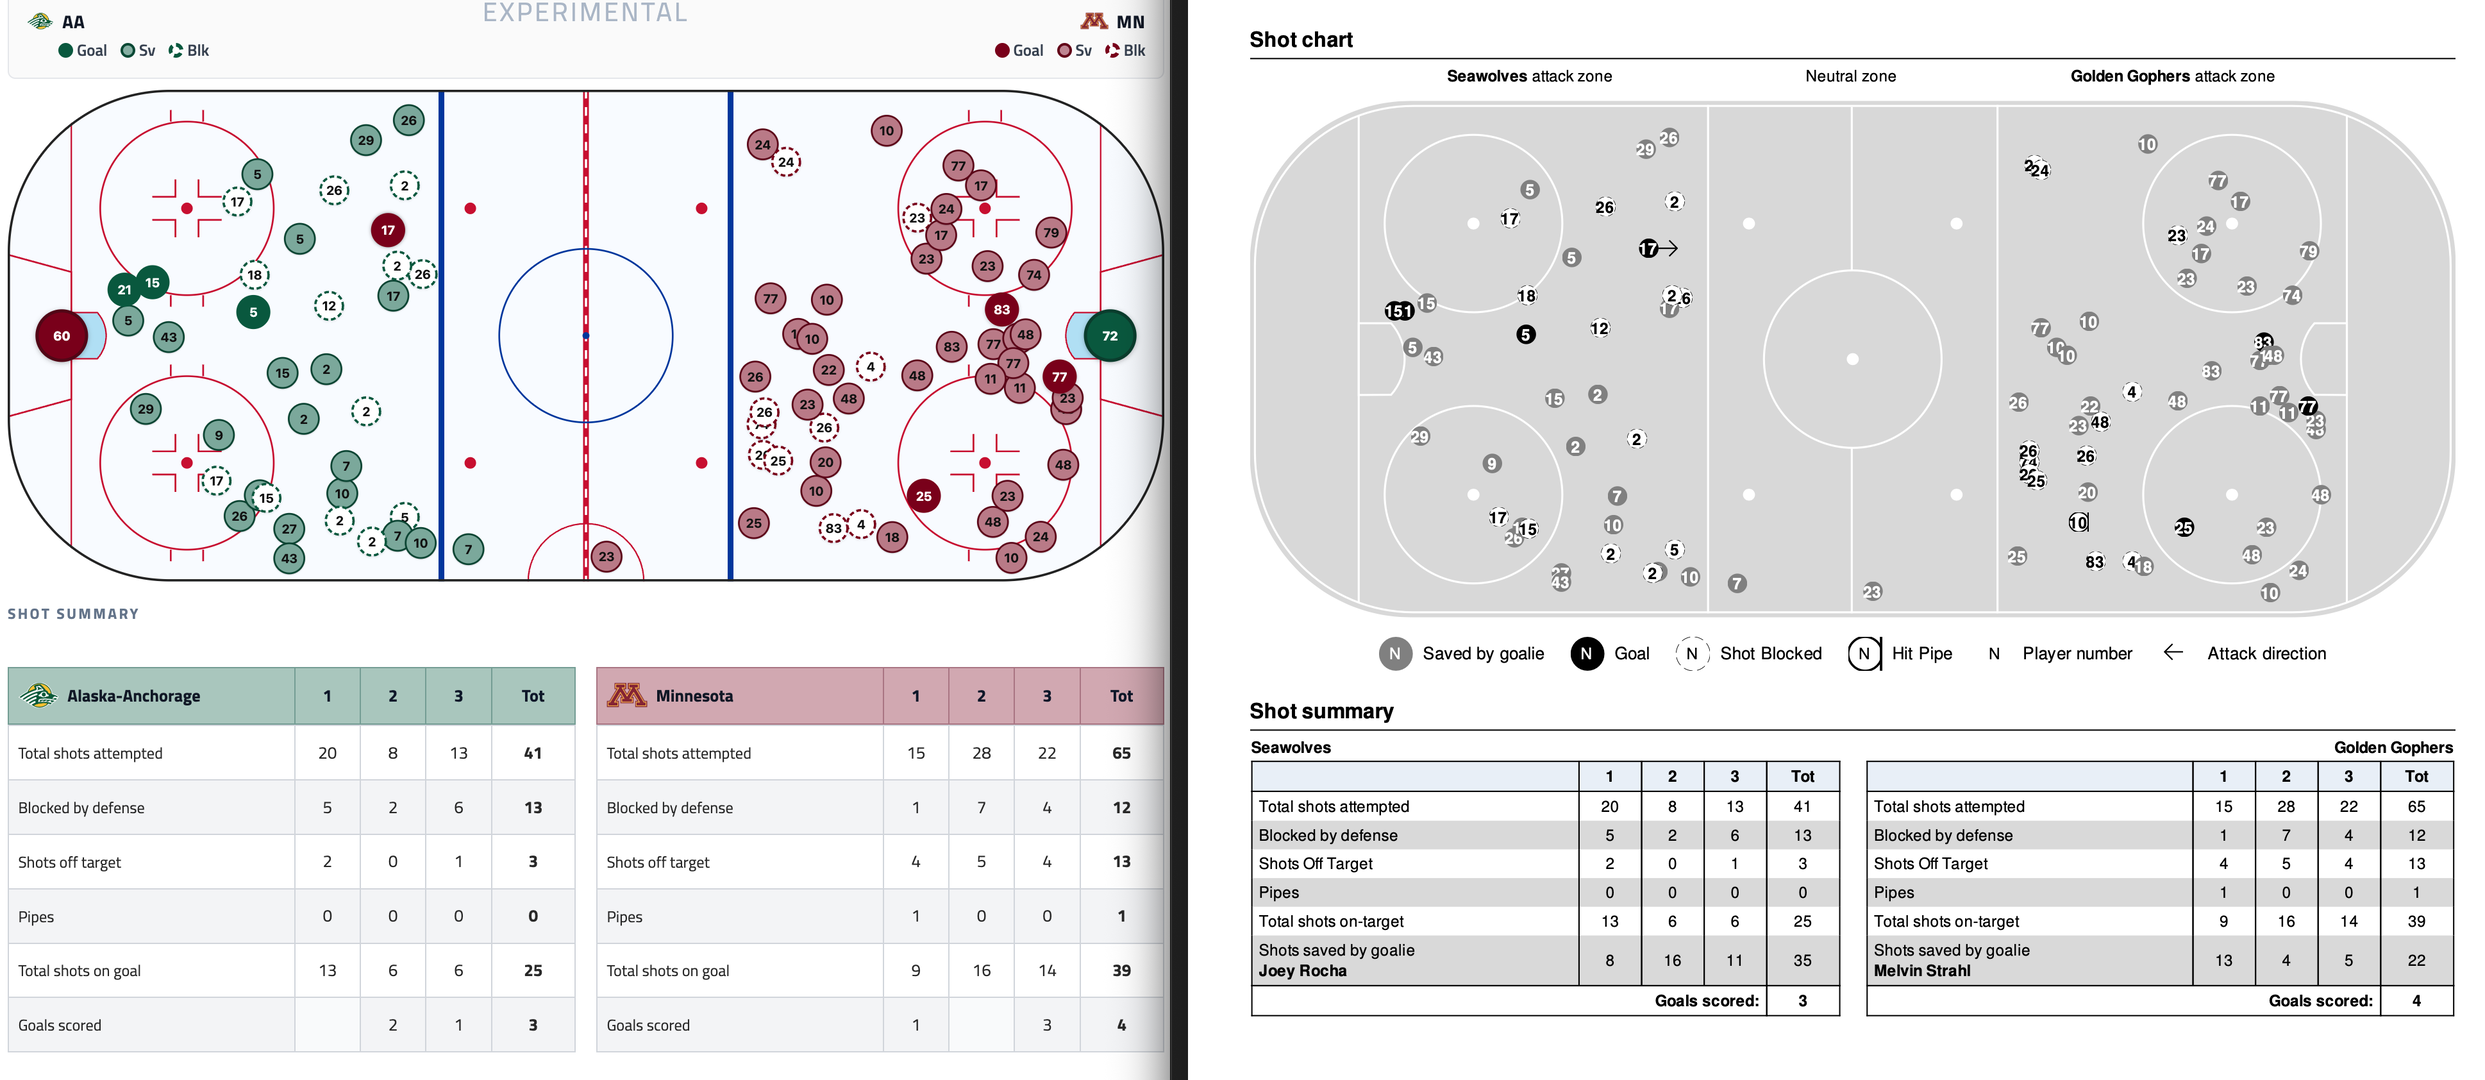
The chart is interactive as well you can zoom in and select a number and it will tell you the player. I added the goalies to the chart as well so you can get a quick peak. You can filter to only show one team, just the goals or just the shots or blocks. It's pretty slick.
I have also added the faceoff chart from the PDF as well. It gives data on the zones and a comparison bars of certain situations below that.
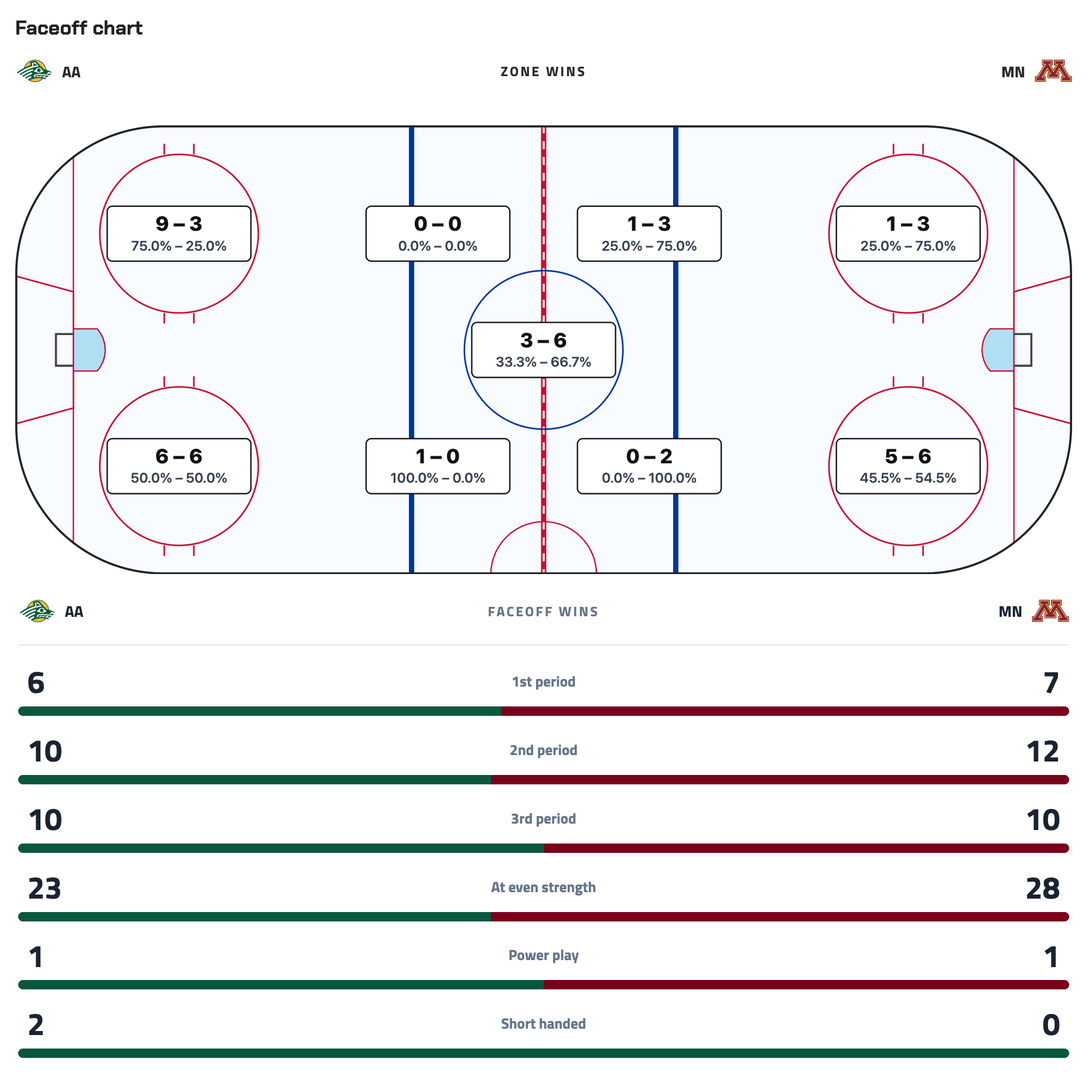
You can go go to any played game for Minnesota and so to the Summary/Charts to check out this data.
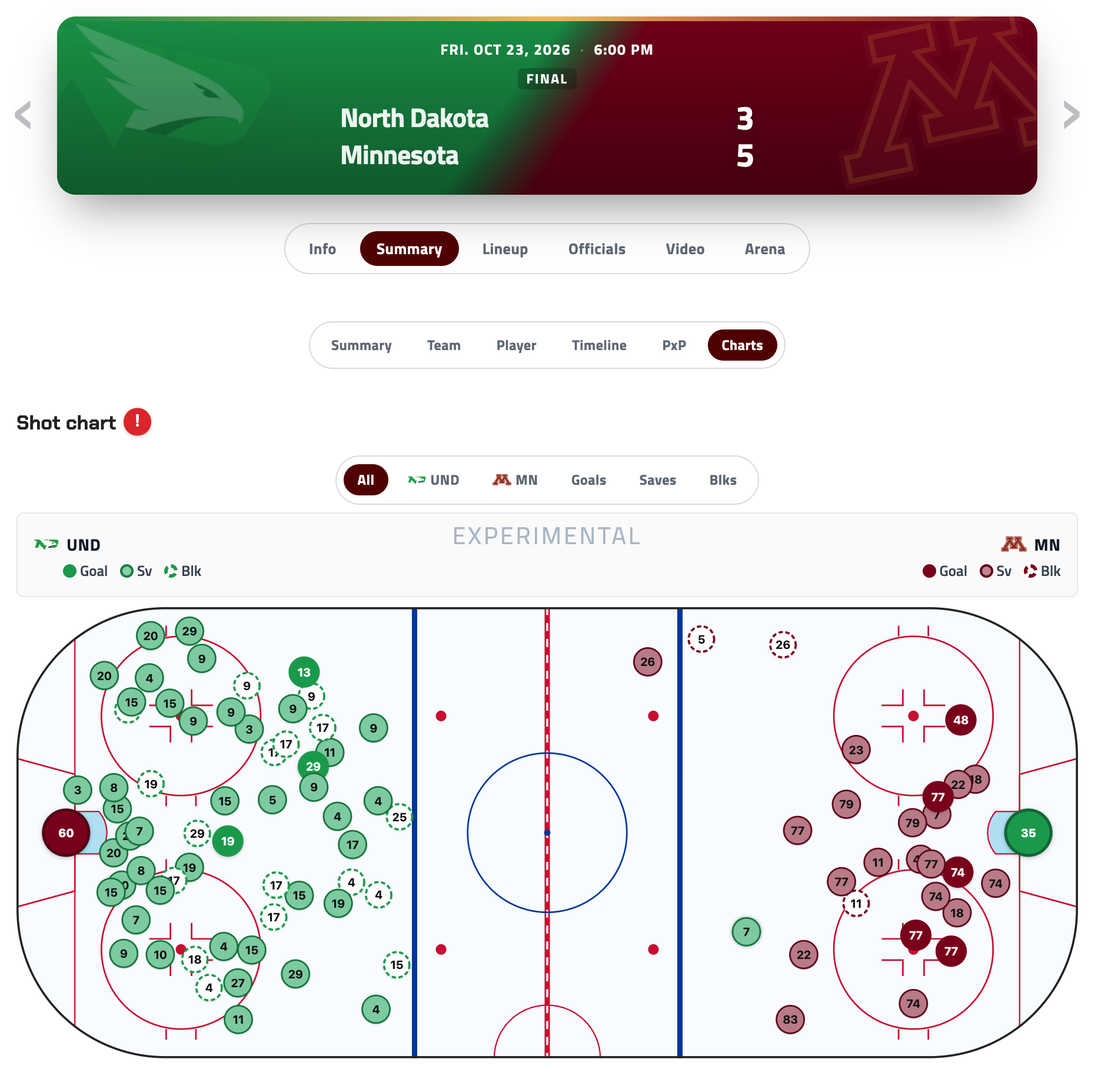
Like I said. This is very experimental and I will keep working on it. But I will be adding this data after I get the main PDF from the UofM. Sometime it will not be until the next day. But we already have to wait until the next day to get the Time On Ice data as well. But this is still a very cool addition to GPL!
Here is a link to the first UND game for you to check it out. I have also added convenient arrows at the top of each game age to move to the previous or next game quickly.
https://gopherpucklive.com/game/north-dakota-at-minnesota-3/#summary-charts
Do not like how this board is run?
Get your own board!
♃

Dumb question - the shot chart is a composite of all three periods just all shown on one end of the ice?
Super awesome though, thanks for continuing to make this site the best!